Tracking Your Performance with Statistics
Slashit’s Statistics tab gives you a smart overview of your usage patterns, helping you stay informed and make the most out of your workflow. Whether you’re monitoring productivity or managing your AI usage, this section has all the insights you need.
Where to Find It
Navigate to Slashit → Left Sidebar → “Statistics” tab.
What’s Inside the Statistics Page
The page is divided into four core panels that give you a complete snapshot of your usage:
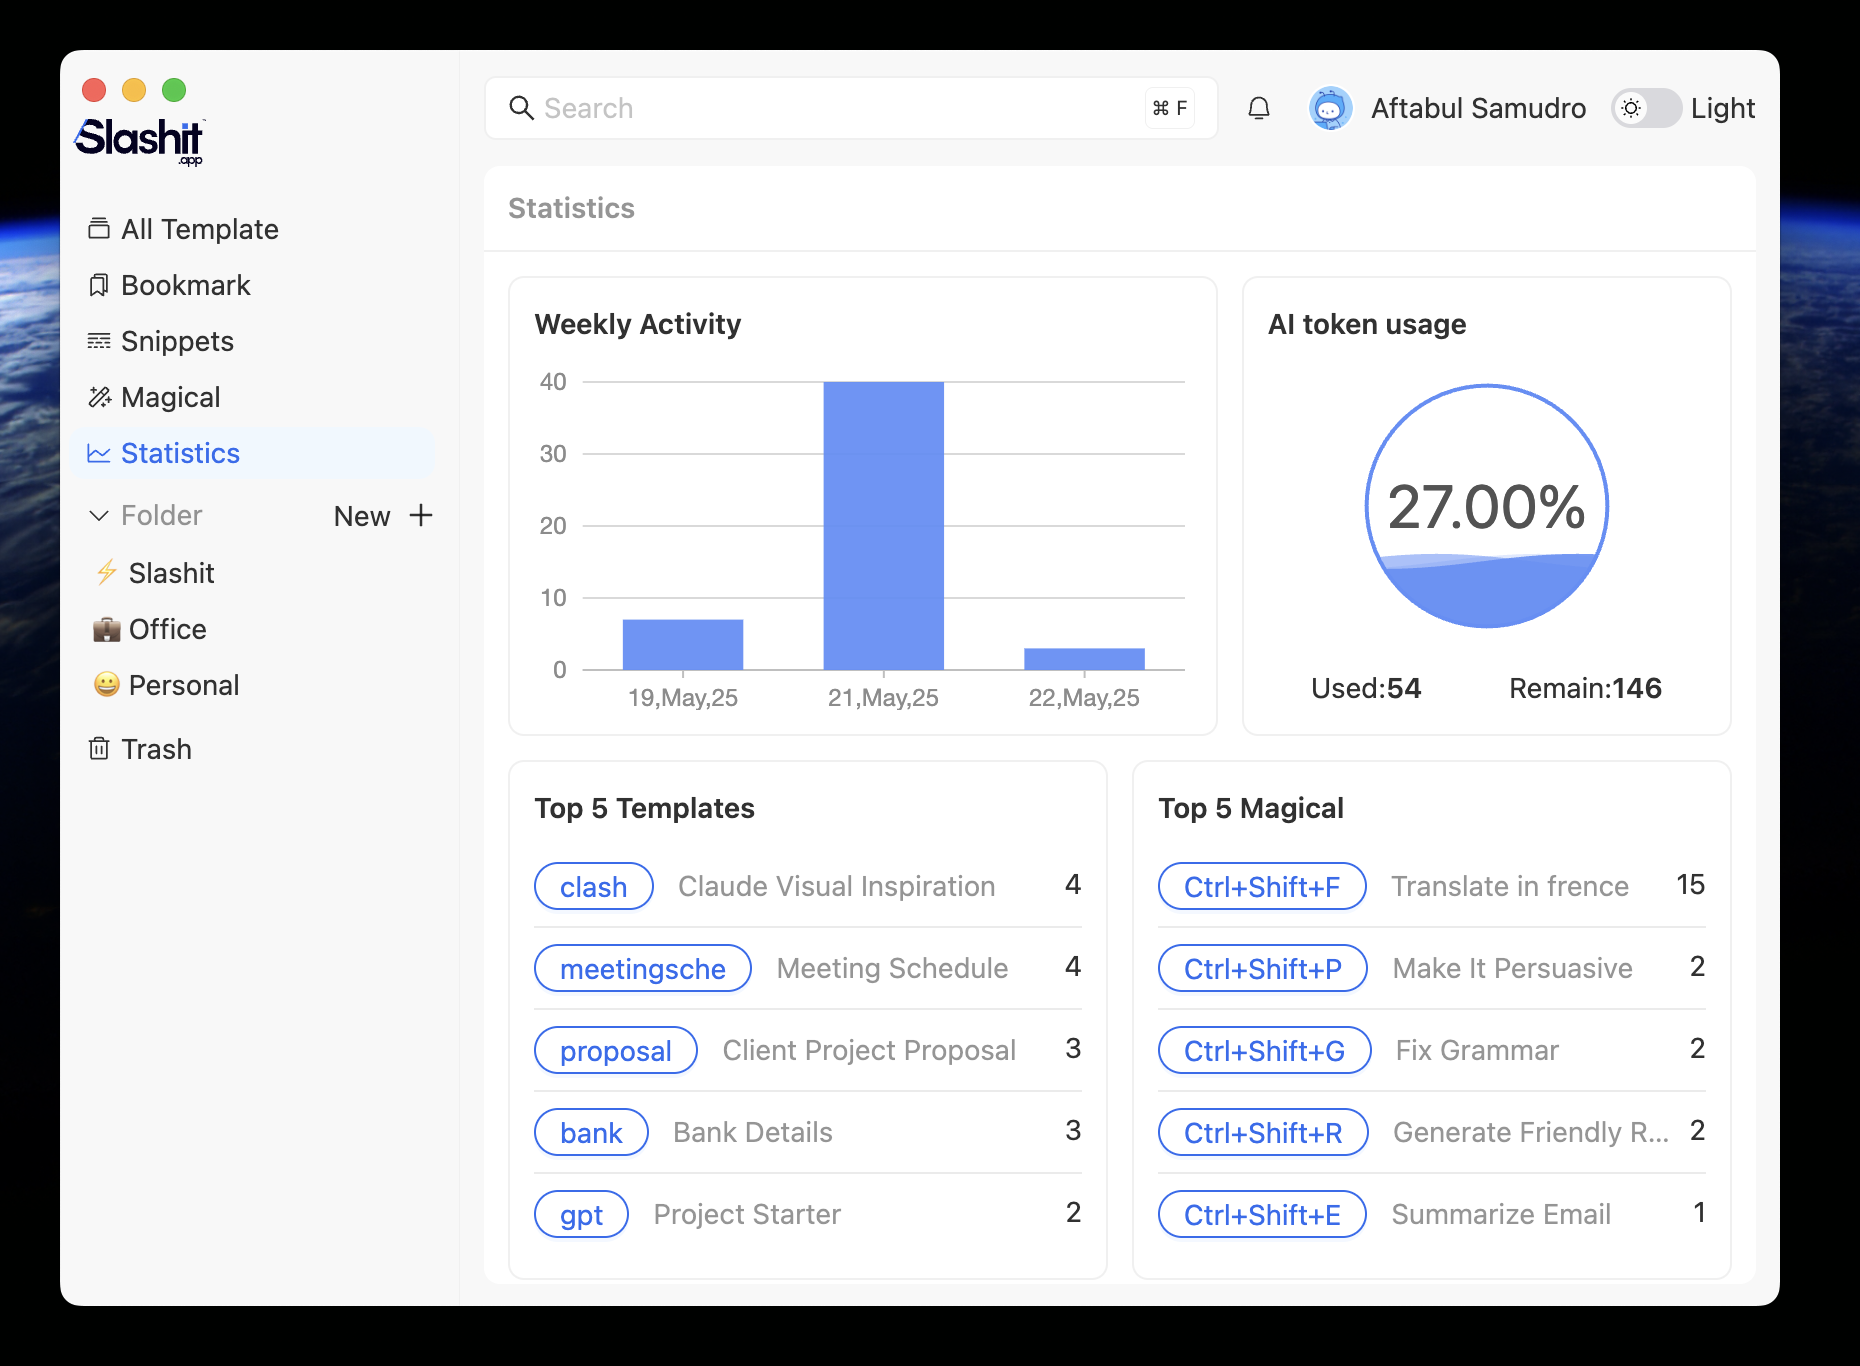
1. Weekly Activity
See how active you’ve been each day.
-
Displays a bar chart with date-wise breakdowns.
-
Shows total command usage count per day, helping you visualize your work rhythm over the week.
2. AI Token Usage (Premium users only)
Monitor your AI usage and remaining balance.
-
A circular pie chart displays used vs remaining AI tokens in percentage form.
-
Below the chart:
-
Used Tokens: Displays the exact number used so far.
-
Remaining Tokens: Shows how many are left in your current billing cycle.
-
3. Top 5 Template
Find out which templates you rely on the most.
-
Shows your top 5 most-used templates.
-
Each entry includes:
-
Template Title
-
Assigned Shortcut
-
Usage Count
-
4. Top 5 Magical
Track your favorite magical commands at a glance.
-
Lists the top 5 magical commands based on usage.
-
Each entry shows:
-
Magical Title
-
Assigned Hotkey
-
Usage Count
-
Why This Matters
-
Understand your most productive days and tool usage trends.
-
Keep an eye on AI token limits to avoid surprises.
-
Identify your go-to templates and magicals—so you can optimize or share them.
-
Perfect for solo professionals and Premium users who want data-driven control.